


This article is an on-site version of our Unhedged newsletter. Sign up here to get the newsletter sent straight to your inbox every weekday
Good morning. Yesterday, a reference to the film Caddyshack provoked a lot of approving mail. Does that mean most of our readers grew up in the 1980s, or just have excellent taste? Send other market-applicable movie quotes to: robert.armstrong@ft.com and ethan.wu@ft.com.
Trade-off time is here
We’ve been moaning for some months about confusing, contradictory or equivocal economic data flowing out of the US economy. But recent reports, in a refreshing change, have mostly been singing from the same hymnal.
Wednesday’s CPI numbers were, on balance, encouraging. A second consecutive month of falling shelter inflation was particularly welcome. Yesterday’s producer price index was good, too. Year on year, core PPI has plunged from 10 per cent to 3 per cent in 13 months. “Peak inflation data continues in the pipeline,” as Don Rissmiller of Strategas puts it. At the same time, a rise in unemployment insurance claims this year adds evidence that the tight labour market is weakening. Put together, we’ve got an economy that’s slowing, and disinflating.
The chart below illustrates this. It shows smoothed data for jobless claims (dark blue), core PPI (pink) and trimmed mean CPI (light blue), a measure that excludes the hottest 8 per cent and coldest 8 per cent of CPI sub-components. Jobless claims are jumping, PPI is coming down fast and trimmed CPI is following, but slowly:


For a year and change, the Fed has wrestled with making live monetary policy decisions using backward-looking data. But it had something going for it: the economy was obviously too hot. Both sides of its dual mandate (price stability and employment) pointed in the direction of tightening. Now, inevitably, the dual mandate is coming back into conflict. We wrote this in July 2022:
In a sense, the Fed’s job is easy now. Inflation is very high and unemployment is very low. What it must do — raise rates, fast — is clear. But imagine a scenario in which inflation is still way too high, say 5 per cent, and falling. At the same time, imagine that unemployment is higher, say approaching 5 per cent again, and rising. What does the Fed do then?
Things are better now than we imagined then. Headline inflation is indeed 5 per cent and falling, but the unemployment rate is still just 3.4 per cent. It’s entirely possible that the tightening done so far — 500bp of rate increases, $400bn in asset run-off and a few bank failures, to boot — is enough to control inflation without much higher unemployment. The soft-landing dream, to our great surprise, remains alive.
But even in an optimistic scenario, inflation will take many months to reach anything resembling 2 per cent. Meanwhile, the economy, while relatively strong, is unbalanced. It is almost entirely reliant on the US consumer. If the labour market keeps weakening, growth could fall fast. And at the apex of a tightening cycle, we should expect more things to break, worsening the economic picture.
Hard choices are coming for the Fed. A rate pause in June seems sensible, but the real question is how long to wait before a cut. Mr Futures Market is betting it won’t be long at all: one 25bp cut in September, and three by year-end. Here Unhedged is still split. Rob is inclined to say the Fed will “higher-for-longer” us right into a recession. Ethan thinks economic deceleration later this year will force cuts. In a few months’ time, our divide could well be mirrored at the Fed. (Ethan Wu)
Uber vs Airbnb
Uber and Airbnb are companies with almost identical business models, built around different assets. Both run global marketplaces on which owner/operators can rent an asset to a customer. In one case, the asset is a car; in the other, a house. Both companies make money by charging the seller a fee for use of the network.
The similarity of the two businesses is brought out neatly by the fact that their values are quite similar and move together. Here is the enterprise value of the two:

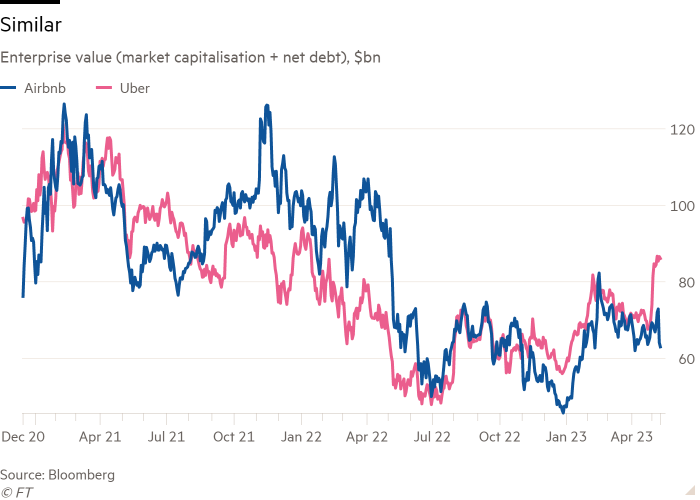
There is, however, something deeply dissimilar about Uber and Airbnb. One of them makes money and the other does not.
Regular readers will remember that we recently argued that the right way to think about Uber’s profitability is in terms of what we call true free cash flow: operating cash flow, minus capital expenditures and stock-based compensation (failure to include stock comp in any measure of profitability is, everywhere and always, a lowdown dirty trick). Here is quarterly true free cash flow at the two companies:
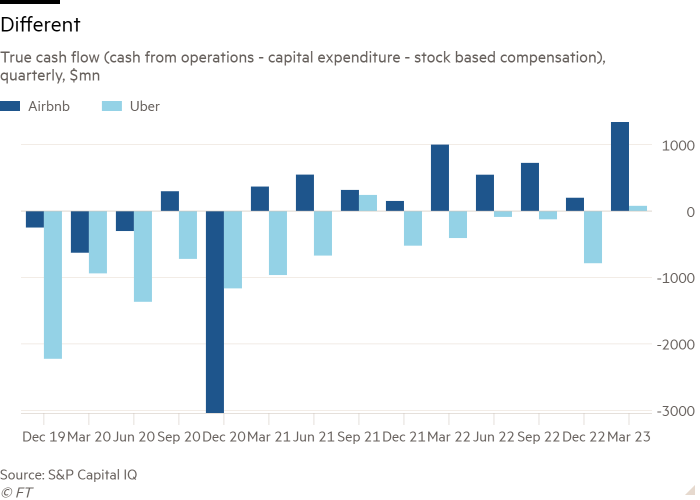
Airbnb generated $2.8bn of true free cash in the past four quarters, a margin on revenues of over 30 per cent. This is a very profitable business! Over the same period, Uber burnt more than $900mn in cash. Given the similarity of the business models, what explains this? I don’t know for sure, but I have a tentative theory which has to do with the fundamental differences between a car and a house.
With companies using a marketplace (“network”, “platform”) model, it is traditional to link profitability with scale. There is a phase while the network is being built up where the business is lossmaking, but when it gets to a certain size, costs stabilise and cash starts to flow. But given that Uber’s revenue, at $33bn, is four times Airbnb’s, it is hard to argue scale explains the difference here.
A closely related, somewhat more convincing theory is that Uber, whatever its size, has decided to invest more aggressively than Airbnb has, sacrificing profits now for profits later. In other words, Uber could be profitable at its current scale but chooses not to be. It is true that Uber is increasing revenues faster than Airbnb (58 per cent in the past 12 months, versus 32 per cent). It is also true that Uber is adding new services (deliveries, freight). There could be truth to this theory, but I doubt that it is the whole story.
What makes me doubt it is the big difference between the two companies’ gross profit margins:

For both, revenue is fees charged to the asset owner/operators. Here’s what Uber says goes into cost of revenue (that is, the costs subtracted from revenue to arrive at gross profit):
Cost of revenue, exclusive of depreciation and amortisation, primarily consists of certain insurance costs related to our mobility and delivery offerings, credit card processing fees, bank fees, data centre and networking expenses, mobile device and service costs, costs incurred with carriers for Uber Freight transportation services, amounts related to fare chargebacks and other credit card losses.
And here is Airbnb:
Cost of revenue includes payment processing costs, including merchant fees and chargebacks, costs associated with third-party data centres used to host our platform, and amortisation of internally developed software and acquired technology.
One difference here is that Airbnb includes amortisation of technology in cost of revenue line whereas Uber sticks it in a different line further down the income statement. But this should make its gross margins higher relative to Airbnb’s, not lower.
Another, possibly more important difference is that Uber flags insurance costs right off the bat. This raises a crucial point: you can’t crash a house, or at least not without serious effort. I’m guessing that insurance costs for every unit of revenue at Uber’s business are much higher than Airbnb’s, and that these higher costs are almost completely variable, that is, they increase with revenue (whether those insurance costs are borne directly by Uber or by the asset owner/operators, who then have to be compensated for them, is irrelevant).
I have a lot more work to do on these two fascinating companies; insurance could be a red herring. What is clear is that Uber’s cost of goods includes large, variable costs that Airbnb’s do not. I’m keen to hear from readers who know more. (Armstrong)
One good read
Steven Kelly pushes back on the technology/social media theory of bank runs.
Recommended newsletters for you
Due Diligence — Top stories from the world of corporate finance. Sign up here
The Lex Newsletter — Lex is the FT’s incisive daily column on investment. Sign up for our newsletter on local and global trends from expert writers in four great financial centres. Sign up here


