


This article is an on-site version of our Unhedged newsletter. Sign up here to get the newsletter sent straight to your inbox every weekday
Good morning. On Tuesday, a day after Unhedged wrote “Growth stocks win again”, growth stocks won, again. The S&P 500 fell a bit yesterday, but growth was unbothered. Google even staged a nice little rally, after Bill Ackman and Dan Loeb disclosed fresh investments. Today, more on consumers and a look at high-yield bonds. Email us: robert.armstrong@ft.com and ethan.wu@ft.com.
Retail week, part I: Home Depot (and the retail sales report)
The first leg of this week’s Home Depot/Target/Walmart results trifecta is in. The home improvement superstore’s numbers were weak, but judging by the “meh” response from the stock price, not much worse than expected. The results do, however, raise important issues about the trajectory of overall consumption for the rest of the year.
Home Depot’s same-store sales were down 4.5 per cent versus the year before. Excluding the effect of the big fall in lumber prices, the decline was only 2.3 per cent. This still isn’t great, though, given that the company is still seeing item-level (“SKU”) inflation on non-commodities. Real sales growth can’t be precisely estimated, but it was significantly negative (down mid-single digits? worse?). Average transaction size was stable, but fewer customers are coming in.
Management mentioned several details that suggest an increasingly cautious consumer. Big-ticket items like grills, appliances and patio furniture were particularly soft. And the kinds of projects contractors are working on “are changing from large-scale remodels to smaller projects”.
The company expects same-store sales to be between minus 2 per cent and minus 5 per cent for the full year. That’s a wide range. The difference between the high and low ends, management says, is the company’s share of household consumption. Home Depot added significantly to its share of consumer spending during the coronavirus pandemic. The company’s annual run rate of sales rose from about $110bn to about $150bn in the past three years. How much of that will it have to give back? Management was frank: they don’t know. Here is chief executive Ted Decker (yes, in a major victory for nominative determinism, the CEO of Home Depot is named Decker):
We don’t know where [the shift in consumption] ends or how quickly it goes. There’s an argument that [personal consumption expenditures] and home improvement [both] stay elevated . . . home values are so much higher. The age of the home is considerably older on average. People are spending more time at home. So all those dynamics could suggest normalisation might be, in fact, a higher level of PCE spending in our sector
I think that while Home Depot may be an extreme case, the uncertainty about retail spending patterns over the next year or two is a broad phenomenon. Covid changed the way we live, and we just don’t know whether we are ever going back to the old ways.
Look at it this way. Over the past three years, Home Depot grew sales at an average annual rate of almost 12 per cent, in nominal terms. Let’s say that inflation accounts for about half of that (CPI inflation has run at about 6 per cent over three years). That still leaves Home Depot, a quite mature retailer, growing at three times the rate of GDP in real terms. This leaves two pressing questions.
One: how much of that growth is demand that was pulled forward and will be given back in the next few years? Two: how much will the valuation of these companies change when growth is much lower, in both nominal and real terms? If investors are used to Home Depot putting up 10 per cent nominal sales growth, how do they respond when its run rate in a good year is, oh, 3 per cent? Home Depot’s price/earnings valuation has already come down quite a bit from its pandemic peak, and it now trades at about 18 times, in line with historical levels. But might a discount be coming?
Other large, mature retailers are in similar situations. Many of them — Costco, AutoZone, Dick’s Sporting Goods — grew sales very quickly in the pandemic years and must now be wondering what’s coming next.
The government’s retail sales report will not do much to clarify things for them. The April numbers came out yesterday and, compared with March, the numbers were better than expected — up 0.4 per cent, or 0.7 per cent without cars, car parts and gas. But the monthly numbers are volatile. The strong April follows a weak February and March, and an amazingly strong January. Attempting to smooth the trend and make the number legible, here is the three-month rolling average of the monthly annualised growth rates, with restaurants split out from other retailers:


We squint and see a gentle slowing in consumption from a very high level, but as regular readers will know, that’s what we expected to see. Maybe it’s confirmation bias. What we know for sure is we are in a transition period, and what it is a transition to is even less clear than usual.
High-yield is out of line, but it’s fine
Here’s a rule: when the Fed’s senior loan officer survey (the “Sloos”) shows tightening credit, high-yield bond spreads over Treasuries get wide.
This is intuitive. Stricter lending conditions should pinch shakier borrowers the most, raising default risk and thus yields. But this rule, once sturdy, has broken down. Marty Fridson of Lehmann Livian Fridson Advisors calculates that at current Sloos tightness, the slimmest high-yield spread on record before 2023 was 644bp, observed in 2020. The long-term median with Sloos at current levels is 771bp. Today it is just 476bp. “Way out of line,” says Fridson.
This is just another example of the eerie quiet in nearly all risk markets, which are seemingly defying recession risk. Too quiet, argues Société Générale’s fixed-income portfolio strategy team, which yesterday told clients it was time to ditch high-yield, cutting exposure entirely. They are leery of the Sloos:
Defaults remain near cyclical lows and 1Q earnings were strong, but these are lagging indicators, and the tightening in bank lending conditions suggests defaults will rise, particularly in the US, even if current cash balances are high.
SocGen says to cash out your HY exposure and put the proceeds into emerging-market bonds and Treasuries. They have their own reasons — to gain from a weaker dollar helping EMs and from falling rates helping Treasuries. But you could think of it more simply. Relative to the attendant risks, HY is not yielding much more than Treasuries, so buy stuff that is, plus some Treasuries, too.
Andy Brenner, head of international fixed income at NatAlliance, thinks this is giving HY short shrift. He argues you need to distinguish between HY and proper junk:
I break down credit into three categories: IG, high-yield and junk. I think IG is fine . . . I look at high-yield and I’m neutral to slightly positive. I think the composition of the companies is better, I don’t see a lot of need for reissuance [because balance sheets are broadly strong and maturities have been pushed out], I think the yields are respectable and I don’t have a problem with the spreads .
There’s a lot of companies in the double-B category that were downgrades from triple-B. They’re better companies. It’s a different high-yield than, say, 10 years ago .
Junk [in particular triple-Cs] is where I’m a little more concerned. I’d avoid most of those. I can see the economy slowing down and you see a rise in defaults.
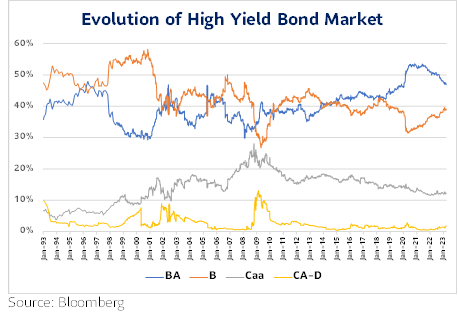
Dec Mullarkey of SLC Management, a friend of Unhedged, strikes a similar tone on the composition of HY, noting three important changes in the past decade. After the financial crisis, banks nervous about lending forced more companies into the bond markets, where they could borrow cheaply. Then, in the shale bust of 2014-16, many energy firms once rated low-IG slid to high-HY, becoming one of the biggest segments in HY. Finally, the pandemic prompted both widespread balance sheet strengthening and credit ratings downgrades. The result is a meaningful increase in HY credit quality. The category now includes the likes of Ford and Kraft-Heinz. The double-B (blue line below, labelled BA) share of the market has surged. Mullarkey’s chart:

Verdad Capital’s Greg Obenshain, who in a past life was a HY portfolio manager at Apollo, offered us this synthesis: He expects spreads will widen, especially for the lowest-rated bonds. But if you already hold high-yield, you don’t need to dump it all. You’ll have done due diligence on its credit quality. Short of defaults, HY is paying a nice coupon, north of 8 per cent. If you need cash, or if you want to de-risk entirely, selling your HY now makes sense. But if you’re happy to wait until maturity and clip coupons, “it’s not a bad place to hide out”, Obenshain told us. “I don’t have such a crystal ball that I’d be 100 per cent in cash right now.”
So while HY may be way out of line versus history, after accounting for improved credit quality they don’t look that much scarier than the big-picture macro risks everyone is aware of. Perhaps that is why investors are not yet in a terrible rush to sell. (Ethan Wu)
One good read
James Montier of GMO on high profit margins.
Recommended newsletters for you
Due Diligence — Top stories from the world of corporate finance. Sign up here
The Lex Newsletter — Lex is the FT’s incisive daily column on investment. Sign up for our newsletter on local and global trends from expert writers in four great financial centres. Sign up here


