


Bitcoin is trading at $117,832.50 with minimal daily movement (-0.10%) as both Claude and ChatGPT identify a key consolidation phase near all-time highs that could determine the next major directional move.
However, they differ in probability weightings and risk assessment approaches. The synthesis of their analyses reveals a 65% probability of an upward breakout, a 25% chance of correction scenarios, and a 10% likelihood of extended consolidation.
Current Market Position and Technical Structure
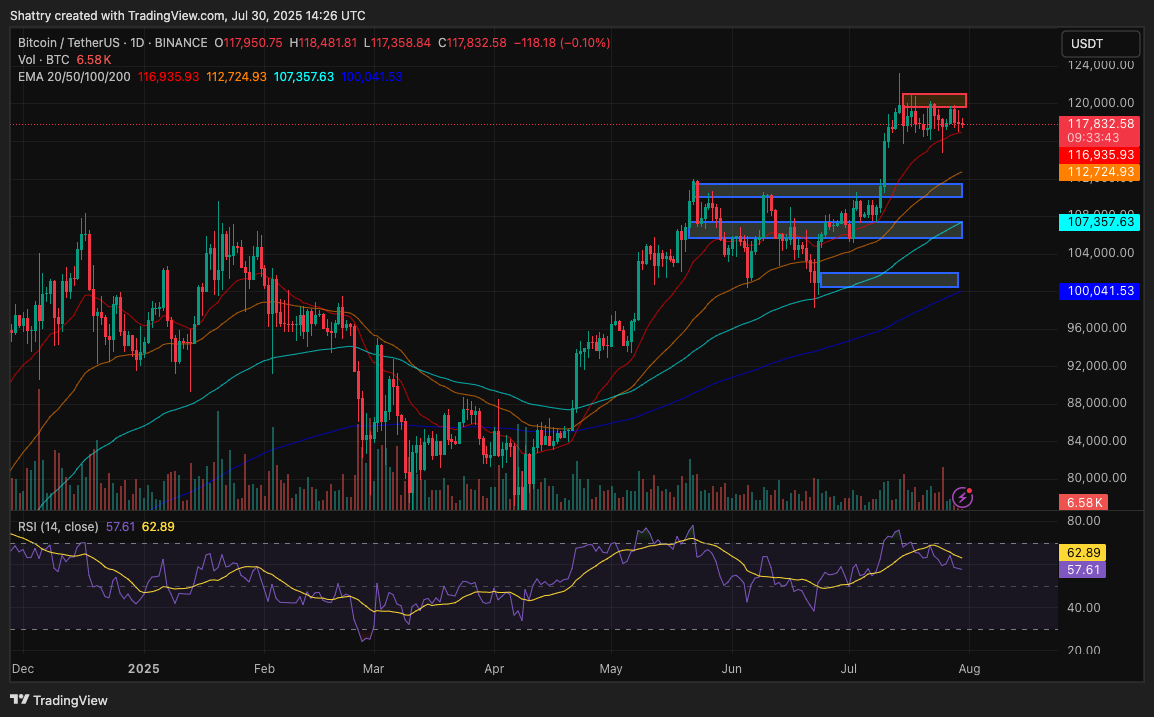
Bitcoin’s position at $117,832.50 represents what both models identify as a “compressed spring” setup, trading within an exceptionally tight daily range of just $1,123 (0.95% of current price).
The technical foundation remains overwhelmingly bullish, with price maintaining strength above all major exponential moving averages: 20-day EMA at $116,935.93 (-0.8%), 50-day EMA at $112,724.93 (-4.3%), 100-day EMA at $107,357.63 (-8.9%), and 200-day EMA at $100,041.53 (-15.1%).


The RSI reading of 57.61 sits in neutral territory, which both analyses point out as particularly essential given Bitcoin’s proximity to all-time highs.
Typically, assets trading near historic peaks exhibit overbought RSI readings above 70, making the balanced momentum reading a bullish divergence sign.
The MACD structure shows mixed signs with the main line at -469.62 below zero, but the positive histogram at 2,330.79 suggests building momentum despite current bearish positioning.

Volume analysis reveals daily trading at just 6.59K BTC, representing what both models interpret as institutional accumulation rather than distribution.
The extremely high ATR reading of 106,893.57 contrasts sharply with the current low volatility, creating what technical analysts call a “volatility paradox” that often precedes strong price moves.
Historical Context and 2025 Performance Trajectory
Bitcoin’s 2025 journey provides key context for understanding current positioning. Starting the year at $102,405 in January, the cryptocurrency experienced a consolidation phase through spring, trading between $107,500-$110,000 from February through May.
June saw a modest close at $110,467 before July’s explosive rally to current levels near $119,850 by month-end.
This historical pattern demonstrates Bitcoin’s ability to break from extended consolidation periods with strong momentum, similar to the current setup.
The fact that Bitcoin has maintained its July gains without a major correction suggests underlying strength that both AI models identify as institutional accumulation rather than speculative excess.
Institutional Dynamics and Market Structure
Both analyses emphasize unprecedented institutional adoption as a primary bullish catalyst.
Strategy’s recent acquisition of 21,021 BTC worth $2.46 billion, bringing total holdings to 628,791 BTC valued at $74 billion, represents the scale of corporate treasury adoption accelerating through 2025.
The SEC’s approval of in-kind creation and redemption mechanisms for spot Bitcoin ETFs eliminates previous operational friction for institutional participants.


The JPMorgan-Coinbase partnership allows mainstream banking integration, while companies like Smarter Web Company, which has crossed 2,000 BTC holdings, and Canaan are adopting Bitcoin as a primary reserve asset, demonstrating the expanding corporate adoption trend.
These developments collectively represent what both models identify as structural changes in Bitcoin’s holder composition, creating more stable price floors and reducing available supply for retail trading.
Current market metrics support this institutional thesis, with market capitalization at $2.34 trillion and fully diluted valuation at $2.47 trillion. The circulating supply of 19.89 million BTC represents 94.7% of the maximum supply, highlighting growing scarcity as institutional demand accelerates.
Social sentiment data presents a fascinating paradox that both AI models identify as a bullish contrarian sign. Despite Bitcoin trading near all-time highs, retail sentiment has declined to yearly lows, with LunarCrush data showing AltRank down 229 positions and Galaxy Score declining 13 points.
However, overall sentiment maintains 81% positivity with 90.98 million engagements and 292.17K mentions. The key insight both analyses highlight is the divergence between institutional accumulation and retail pessimism.
Historical precedent suggests that when smart money accumulates while retail sentiment deteriorates, subsequent moves tend to be particularly explosive as retail FOMO accelerates during breakouts.
The current social dominance of 19.35% indicates strong but not extreme retail attention, leaving room for sentiment-driven momentum.
Recent social media analysis reveals approximately 80% bullish sentiment among active traders, though broader retail metrics suggest caution.
This mixed sentiment profile creates optimal conditions for institutional positioning without retail competition, a setup both models view as fundamentally bullish.
Regulatory Environment and Policy Catalysts
Both analyses emphasize improving regulatory clarity as a strong bullish catalyst.
The pending White House crypto report, though initially not including strategic Bitcoin reserve details, represents progress toward a comprehensive policy framework.
The GENIUS Act implementation and broader regulatory developments provide institutional confidence for treasury allocation decisions. Recent headlines confirm accelerating corporate adoption with companies implementing Bitcoin reserve policies and expanding holdings.
This regulatory clarity removes previous institutional barriers, allowing both models to identify the corporate treasury adoption trend as a primary 90-day catalyst.
90-Day Scenario Analysis
Bullish Breakout Scenario (65% Probability)
Target Range: $125,000-$140,000
Both models converge on this scenario as most likely, driven by institutional accumulation acceleration and technical breakout from current consolidation.
The scenario requires decisive movement above $118,482 resistance with volume confirmation, followed by momentum toward $120,000-$122,000 resistance cluster within 30 days.
Timeline expectations include initial breakout within 2 weeks, consolidation and retest of breakout levels through day 30-45, followed by acceleration toward $125,000-$130,000 by day 60-75.
The more aggressive targets of $135,000-$140,000 depend on sustained institutional flows and potential positive regulatory developments.
Key success metrics include daily volume expansion above 10,000 BTC, successful hold above $120,000 psychological resistance, and continued institutional accumulation.
The scenario assumes no major macroeconomic disruptions and steady progress on regulatory clarity.
Correction Scenario (25% Probability)
Target Range: $100,000-$112,000
This scenario involves failure to break above the current resistance, leading to testing of major support levels.
Initial decline would target the 20-day EMA at $116,936, followed by potential testing of 50-day EMA support at $112,725. Deeper correction could reach the 100-day EMA at $107,358 or psychological $100,000 support.
Trigger events include macroeconomic shocks, unexpected regulatory setbacks, or major institutional selling.
The scenario would unfold over 30-45 days, with initial decline followed by stabilization and potential base-building for future recovery.
Recovery catalysts would include institutional buying at lower levels, positive regulatory developments, or broader risk-asset recovery. Both models view strong institutional selling as unlikely given current accumulation trends.
Extended Consolidation (10% Probability)
Target Range: $115,000-$120,000
This scenario involves continued sideways movement in the current range for 45-60 days before directional resolution.
Characteristics include low volume maintenance, ongoing institutional accumulation without retail participation, and delayed catalyst timing.
The consolidation would create optimal accumulation opportunities for institutional participants while allowing technical indicators to reset. Resolution would ultimately favor the bullish scenario given the underlying fundamental strength.
Technical Price Targets and Key Levels
Immediate resistance emerges at today’s high of $118,482, with a breakout requiring sustained volume above 8,000-10,000 BTC daily.
Key resistance cluster spans $119,000-$122,000, representing previous consolidation highs and psychological levels.
Primary upside targets include $125,000 as the first major extension (6% upside), $130,000 as a strong resistance cluster (10% upside), and $135,000-$140,000 as aggressive targets (15-19% upside). Extended targets reach $150,000, representing 27% upside potential.
Key support levels include $116,936 (20-day EMA) as key short-term support, $112,725 (50-day EMA) as major trend support, and $107,358 (100-day EMA) as key long-term support.
The $100,042 (200-day EMA) represents historic trend line support.
Risk Assessment and Management Considerations
Primary risks include macroeconomic volatility from Fed policy changes or geopolitical developments, unexpected regulatory reversals, and technical breakdown below key support levels.
BIG BREAKING
Fed skips rate cut one more time.Sep-Dec 2024: 3 rate cuts and $BTC went 2x
“Higher For Longer” puts housing markets at risk, slows growth and keep Risk Aseets under pressure. pic.twitter.com/4OyBj1aB2D
— Crypto Millionaire Rohit Sharma (@cmrsbtc) July 30, 2025

The extremely high ATR reading suggests potential for 10-20% daily moves during breakout phases, requiring conservative position sizing and wide stop-loss placement.
Risk mitigation strategies include staged profit-taking at $125,000, $135,000, and $150,000 levels, stop-loss positioning below $107,000 (100-day EMA), and volatility management through options or reduced leverage during high-volatility periods.
Market Structure Evolution and Supply Dynamics
The evolving market structure reflects fundamental shifts in Bitcoin ownership patterns.
Exchange reserves continue declining as institutions move holdings to cold storage, while long-term holders maintain positions despite near-ATH pricing.

Mining operations show reduced selling pressure due to efficient operations and strong price levels.
Demand dynamics show accelerating institutional allocation, consistent ETF positive flows, improving retail access through banking partnerships, and growing sovereign wealth fund interest.
These supply-demand imbalances support both models’ bullish medium-term outlook.
Next Price Trajectory: Synthesis and Conclusion
Synthesizing both AI analyses with current market data reveals a compelling setup for strong upward movement within 90 days.
The confluence of technical consolidation near all-time highs, unprecedented institutional accumulation, improving regulatory clarity, and contrarian retail sentiment creates what both models identify as optimal conditions for major price appreciation.
Base Case Trajectory (65% probability):
Breakout above $118,500 within 10-14 days, momentum toward $120,000-$122,000 by day 30, consolidation and retest through day 45, followed by acceleration toward $125,000-$130,000 by day 75-90.
Timeline Expectations:
- Days 1-14: Breakout above $118,500 with volume confirmation
- Days 15-30: Initial momentum toward $120,000-$122,000 resistance
- Days 31-45: Consolidation and support level testing
- Days 46-75: Resumed uptrend toward $125,000-$130,000
- Days 76-90: Potential extension toward $135,000-$140,000
The current technical setup suggests Bitcoin is positioned for its next major bull leg, with the tight consolidation pattern serving as the launching pad for what could be a historic fourth quarter 2025 rally.
The institutional adoption acceleration, regulatory clarity progress, and supply scarcity dynamics support conviction in higher price targets, while the contrarian retail sentiment provides optimal entry conditions before broader market recognition drives prices higher.
The post Claude AI vs ChatGPT Forecast Bitcoin Breakout, ‘Spring’ Tension Targets $130K Peak appeared first on Cryptonews.
https://cryptonews.com/news/claude-ai-vs-chatgpt-bitcoin-spring-130k-breakout/


