


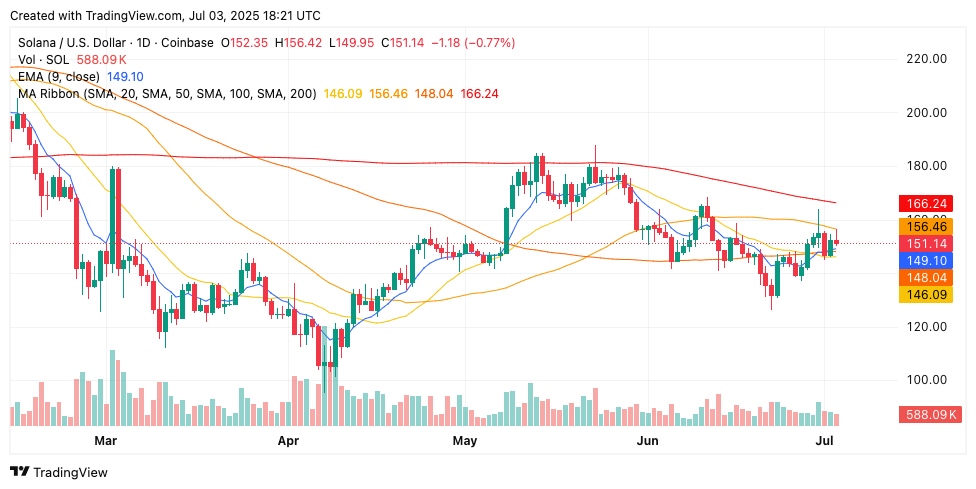
ChatGPT’s AI model processed 42 live indicators, revealing mixed consolidation indicators as Solana (SOL) holds at $150.84 amid a historic staking ETF launch, which generated $33 million in first-day volume and ranks among the top 10 ETF launches of 2025.
DeFi Dev Corp’s new $112.5 million convertible note intends to accumulate SOL while institutional demand accelerates.
SOL, trading above 20-day EMA ($148.67) but below key resistance at 50-day EMA ($151.41), consolidates within a key decision zone as a new staking ETF breaks traditional barriers.

The market cap remains at $81.64 billion, with an explosive 49.49% volume surge to $4.59 billion, validating institutional positioning ahead of potential breakout catalysts.
The following analysis synthesizes ChatGPT’s 42 real-time technical indicators, staking ETF developments, institutional accumulation metrics, and ecosystem fundamentals to assess SOL’s 90-day trajectory amid the first-ever U.S. staking ETF breakthrough.
Technical Crossroads: Mixed Signals Define Critical Consolidation
Solana’s current price of $150.84 reflects a modest 0.94% daily decline, establishing a trading range between $156.35 (high) and $149.86 (low). RSI at 51.07 sits perfectly neutral, indicating balanced momentum without directional bias.


MACD indicators display conflicting signals, with the MACD line at 1.57 trading above zero, confirming underlying bullish momentum. However, the negative histogram at -2.50 suggests momentum divergence requiring careful monitoring.
The complex EMA positioning reveals SOL’s current technical dilemma, as it trades above the 20-day EMA ($148.67), providing short-term support, but faces resistance from the 50-day EMA ($151.41), 100-day EMA ($154.00), and 200-day EMA ($159.34). This creates a narrow decision zone where breakout direction determines trend continuation.
Staking ETF Shift: $33M First-Day Volume Shocks Market
The launch of the first-ever U.S. staking ETF achieved unprecedented success with $33 million in first-day trading volume, ranking among the top 10 ETF launches of 2025 out of 900 total launches.
Bloomberg’s senior ETF analyst has confirmed this exceptional performance validates massive institutional demand for yield-generating crypto exposure.
REX Solana Staking ETF (SSK) provides a new combination of SOL price appreciation and staking rewards, addressing the key limitation identified by institutional investors.
The staking component generates approximately 7–8% annual returns through on-chain validation rewards, greatly exceeding traditional fixed-income alternatives.
Nine major asset managers, including Invesco, Galaxy, VanEck, and Fidelity, have filed additional applications for Solana ETFs, with Bloomberg analysts projecting a 98% approval probability by July 2025.
Historical Context: Recovery from Correction Establishes Base
Solana’s 2025 performance demonstrates remarkable resilience following January’s all-time high of $294.33. The subsequent correction to February’s $148.03 and March’s $124.69 established key support levels that continue to provide a foundation for the current consolidation.
April–May recovery to $147.64 and $160.80, respectively, demonstrated accumulation patterns that attracted institutional interest. June’s $154.74 close established the current trading range boundaries that define ongoing consolidation dynamics.
Current price action represents a 49% discount to all-time highs, providing attractive institutional entry points while maintaining extraordinary gains of over 30,000% from the 2020 lows. This risk-reward profile appeals to institutional investors seeking exposure to proven blockchain infrastructure.
Support & Resistance: EMA Confluence Creates Decision Zone
Immediate support emerges at today’s low around $149.86, reinforced by strong 20-day EMA support at $148.67.
This convergence provides a foundation for any retracements during the current institutional positioning, while maintaining an uptrend structure.
Major support zones extend from $140.00 to $145.00, representing previous accumulation levels, followed by strong support at $130.00-$135.00, corresponding to the lows of the March correction.
These levels provide multiple safety nets that appeal to institutional risk management.
Resistance begins immediately at the 50-day EMA at $151.41, representing the first hurdle for continued bullish momentum. The key resistance cluster occurs between the 100-day EMA ($154.00) and the 200-day EMA ($159.34), creating a challenging overhead supply zone.
Breaking above $159.34 would indicate a complete technical reversal and momentum acceleration toward the previous resistance at $180.00–$185.00.
The ultimate target remains the historical resistance zone around $260.00–$270.00, representing previous cycle highs.
Ecosystem Fundamentals: High-Performance Infrastructure Drives Growth
Solana maintains its position as the sixth-largest cryptocurrency, with a 2.41% market dominance, distinguished by processing over 65,000 transactions per second and achieving sub-second finality.
These technical capabilities support rapidly expanding applications across DeFi, NFTs, and payment solutions.
Network activity reveals 4.2 million active weekly wallets, representing a 32% growth over 90 days, which demonstrates sustained user adoption beyond speculative trading.

Application revenue exceeded $1 billion for two consecutive quarters, indicating economic viability and productivity of Solana’s ecosystem.
Market Metrics: Explosive Volume Confirms Institutional Interest
Solana maintains an $81.64 billion market capitalization with an exceptional 24-hour trading volume of $4.59 billion, representing a massive 49.49% surge. The volume-to-market cap ratio of 5.5% indicates intense institutional positioning ahead of regulatory catalysts.
The circulating supply of 534.73 million SOL represents 88% of the total supply, providing transparency that appeals to institutional treasury management. Current pricing is 49% below all-time highs, providing attractive institutional entry points while maintaining substantial appreciation potential.
LunarCrush data reveals strong community engagement, with a Galaxy Score of 71, indicating positive sentiment momentum is building around the success of staking ETFs. The 81% positive sentiment reflects the community’s enthusiasm for institutional validation and technical developments.
Social dominance of 13.15% with 28.18 million total engagements demonstrates Solana’s ability to capture strong attention relative to market developments.
The 151.64K mentions and 40.54K creators contributing to discussions validate sustained community interest.
$SOL is showing signs of a bullish reversal after forming a double bottom near $141.84 and an inverse head and shoulders pattern.
The price bounced from a major low at $125.99 and is now attempting a pullback around $153.00. #Solana #Tradingview pic.twitter.com/kPU6SsXnZ9
— BitGuru
(@bitgu_ru) July 3, 2025


The Fear and Greed Index, at 74, indicates strong bullish sentiment, with the RSI at 62.4 providing moderate momentum without indicating overbought conditions.
This balanced optimism supports sustained appreciation rather than speculative excess.
90-Day SOL Price Forecast
ETF-Driven Institutional Surge (Bull Case – 45% Probability)
Continued ETF inflows, combined with additional institutional accumulation, could drive appreciation toward $200–$240, representing a 33–55% upside. This scenario requires a successful breakout above $159.34 resistance with sustained volume confirmation.
Technical targets include $180, $200, and $230 based on historical resistance levels and institutional flow patterns. The staking component could attract yield-focused institutional investors seeking alternatives to traditional fixed income.
Consolidation Extension (Base Case – 40% Probability)
Continued range-bound trading between $145 and $165 could persist through Q3 2025, as institutional positioning develops gradually. This scenario allows technical indicators to reset as the ETF adoption process progresses.
Support at the 20-day EMA around $148.67 would likely hold during consolidation, with volume normalizing around 2–3 million SOL daily. This sideways action provides accumulation opportunities without substantial downside risk.
Technical Correction (Bear Case – 15% Probability)
Breaking below the $148.67 support level could trigger a correction toward $130-$140, representing a 14-19% downside. This scenario would require broader market weakness or disappointment in institutional demand.
The strong fundamental backdrop and institutional adoption trends limit extreme downside scenarios, with major support at $130–$135 providing key long-term trend support.
SOL Forecast: Key Levels to Monitor
Solana’s positioning reflects the convergence of technical consolidation and accelerating institutional adoption.
The current consolidation between $148 and $160 creates an optimal positioning for breakout acceleration.
Technical indicators suggest a key decision point, with support above the 20-day EMA while facing resistance from higher EMAs. Institutional validation through ETF success provides fundamental support, positioning SOL for sustained appreciation as adoption accelerates throughout 2025.
The post ChatGPT’s 42-Signal Spots $160 SOL Breakout as Staking ETF Volume Hits $33M appeared first on Cryptonews.
https://cryptonews.com/news/chatgpts-42-signal-sol-analysis-flags-critical-160-breakout-amid-historic-staking-etf-launch/


