


Author
Ahmed Barakat
Author

Share
![]()

Fact Checked by
CryptoNews Editorial Team
Author


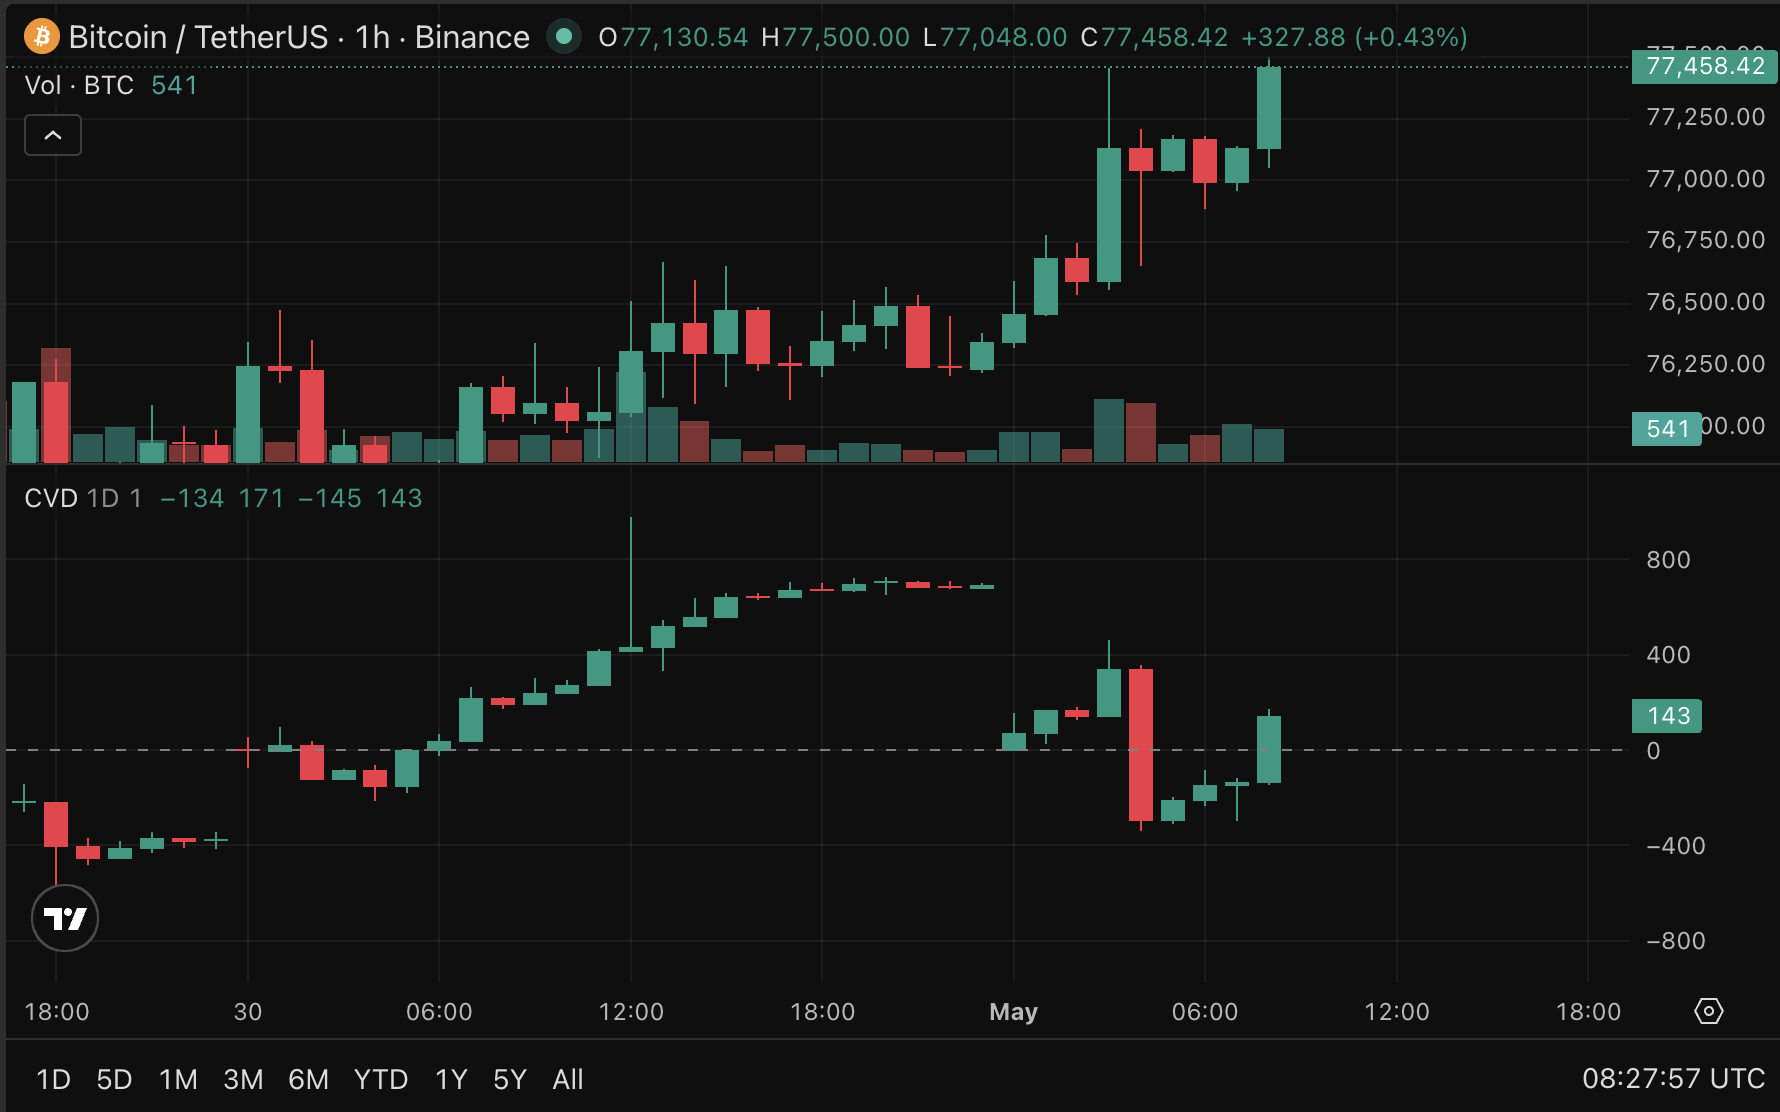
Bitcoin BTC Spot CVD, or Cumulative Volume Delta, exploded 199.1% over the prior week, climbing from $18.3 million to $54.8 million, a signal of aggressive spot-market buying. Parallel perpetual CVD rose 174.7% to $315.1 million, confirming the same directional pressure across both markets. ETF inflows are re-accelerating again after weeks of stagnation, providing the absorption layer and holding Bitcoin above $78,000.
BlackRock’s IBIT gained 1.33% in yesterday’s session as institutional crypto demand showed renewed aggression following a 3-day period of net outflow pressure. The re-acceleration follows a stretch in which ETF outflows had weighed on spot liquidity.

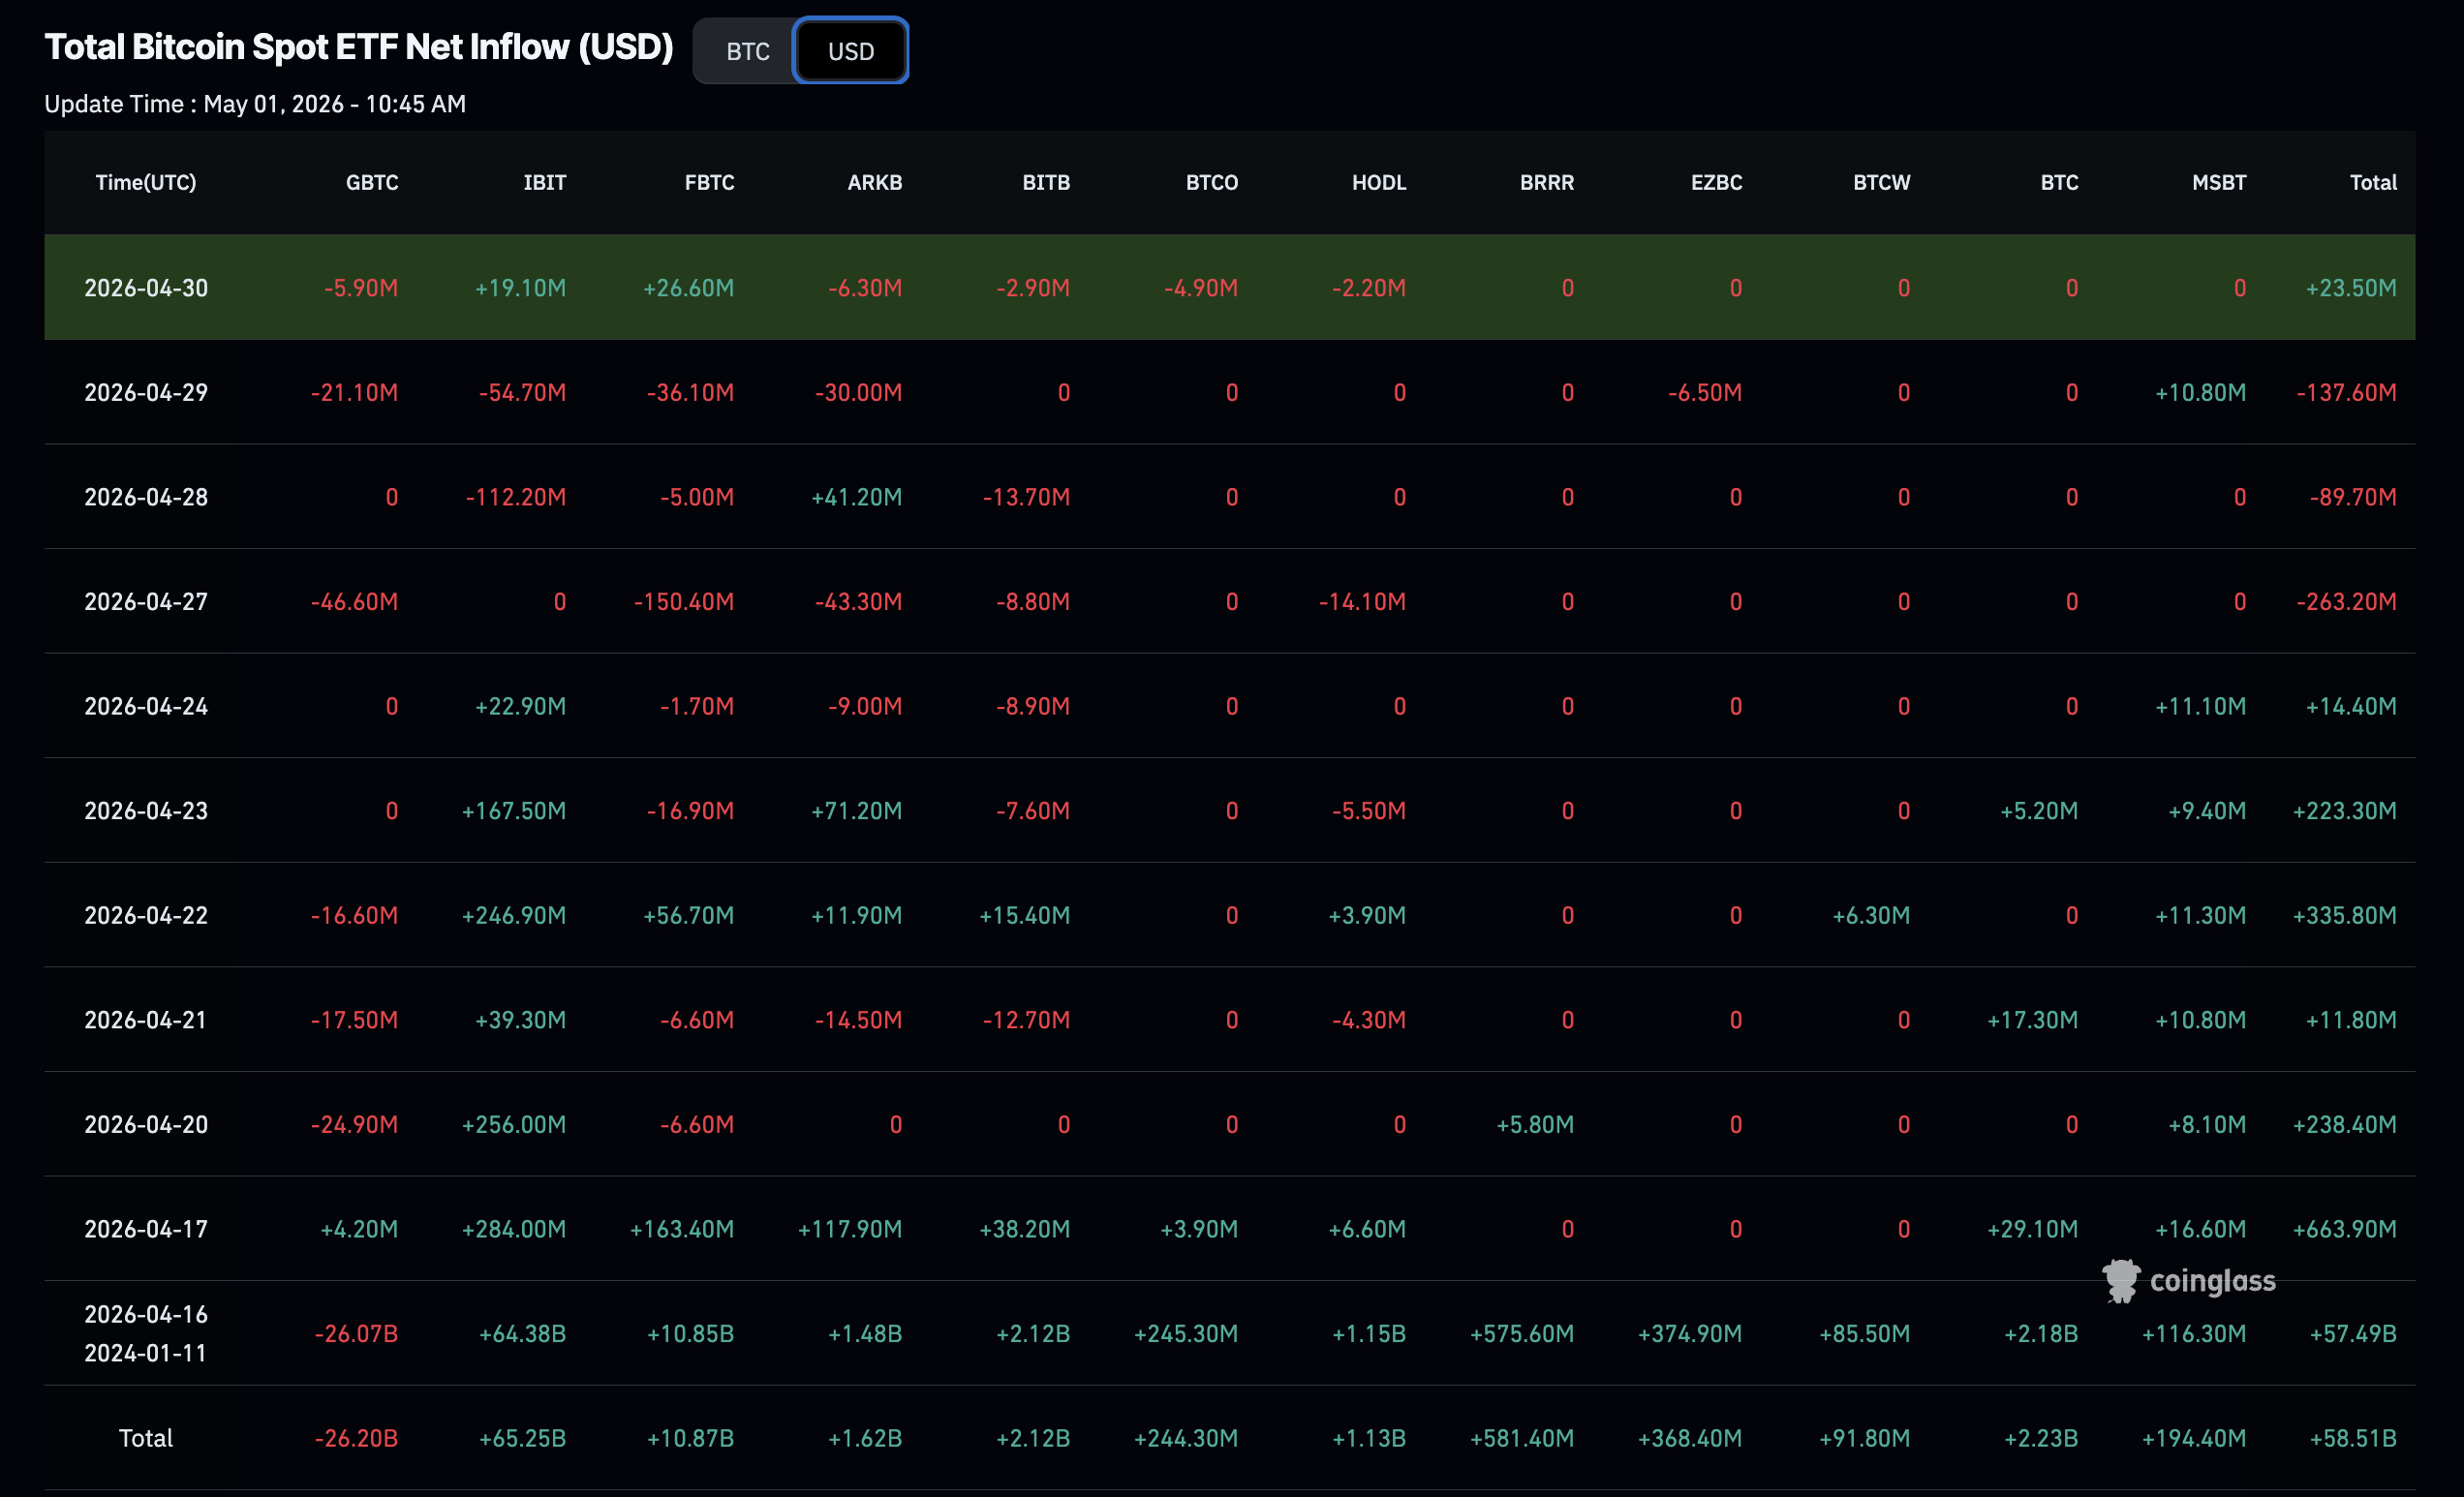
Open interest recovered to $25 billion, which Bernstein analysts flagged as a sign of returning leverage. Spot-led nature of this move, confirmed by CVD composition, shows that the rally has a different foundation than January’s futures-driven spike.
Explore: Bitcoin price prediction – key support and resistance levels to watch
Can Bitcoin Finally Breach $80K This May?
Bitcoin is sitting at $77,000 intraday after reclaiming the same support level. CVD lines are holding above their moving averages, which is the minimum confirmation for bullish conviction. RSI is elevated but not yet at overbought extremes, leaving room for continuation.

If $75,000 holds on a weekly close, the structure opens a move toward $80,000 and, beyond that, the $82,000 zone identified by on-chain resistance clustering. If $75,000 breaks, the real floor is closer to $72,000. The risk case is an open interest flush, $25 billion in OI with rising leverage could create a liquidation cascade.
The honest read: structure is bullish as long as spot CVD stays positive and ETF inflows don’t reverse. Watch the weekly close.
Discover: The best pre-launch token sales
Wall Street Backdrop: Market Structure Flips Bullish
The macro context is supportive. The Wall Street rally, driven by strong Alphabet and Caterpillar earnings, sent U.S. equities into April’s close with positive momentum, and Bitcoin followed, rising 1.17% in direct correlation with NASDAQ risk-on sentiment.
As we know, traditional fund managers are increasingly treating BTC as a high-velocity proxy for high-beta tech exposure, tightening its correlation with equities in trending macro environments.
Bitcoin is now printing higher lows, has reclaimed $77,000 as support, and is holding a bullish market structure. If equities sustain their recovery through the next FOMC decision, BTC’s macro tailwind stays intact and amplifies the spot demand signal.
The combined read from CVD, ETF inflows, and on-chain transfer volume points to one conclusion: this is a structurally supported move, not a leverage blip.
Discover: The best crypto to diversify your portfolio with
https://cryptonews.com/news/bitcoin-spot-cvd-surges-institutional-inflows-78k/


