
Ethereum (ETH) has taken a hit after the Middle East conflict escalated. The US launched precision strikes on Iran’s nuclear sites, Fordow, Natanz, and Isfahan – and Iran responded with missile attacks and the threat of a broader war.
As the situation worsened, ETH dropped 5% to $2,270.86 and 6.4% in 24 hours. Trading volume surged to $21.6 billion as risk-off sentiment and volatility spiked across crypto.
ETH is currently the second-largest cryptocurrency by market cap, at $274 billion, with 120.7 million ETH in circulation. While the macro headlines are dominating the narrative, the technicals offer some insight for traders.
Ethereum Breaks Below Key Support; More Downside Ahead?
From a technical perspective, the Ethereum price prediction appears weak. The price has been forming lower highs capped by a descending trendline from the $2,900 high. This trendline has been rejecting all the bullish attempts and shows bearish control.
The break below $2,378 horizontal support is significant. This level was a floor through most of May and early June and has now become resistance. The three black crows candlestick pattern is a bearish reversal pattern, indicating further selling.
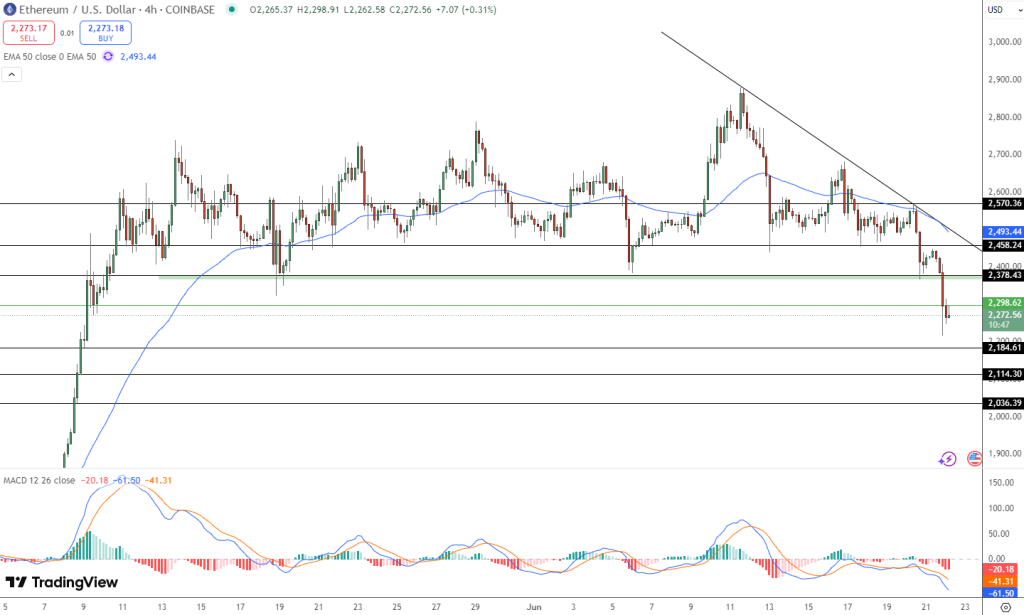
ETH is also below the 50-period EMA at $2,493. This EMA is dynamic resistance in a downtrend, confirming the bearish setup.
Moreover, the MACD is showing a widening gap between the MACD and signal lines (-20.18 vs -41.31) and a declining histogram. A bearish MACD divergence was visible before the drop as momentum faded even as ETH tried to hold above $2,400.
Trade and Levels to Watch
With $2,378 now resistance, ETH traders should look for a bearish retest of that level. If the price attempts to reclaim this zone but fails, especially with bearish candlesticks such as a spinning top or a bearish engulfing pattern, it will create a low-risk short setup.
Trade Setup:
- Entry Range: $2,370–$2,378 on a confirmed rejection
- Stop-Loss: Above $2,400 to avoid false breakouts
- Target 1: $2,114 – A strong historical support zone
- Target 2: $2,036 – Deeper demand level last tested in April
Also, watch for RSI divergence or reversal candles at $2,114 to see if the downtrend is exhausted. In summary, the recent sell off is a mix of geopolitical and technical.
Until ETH reclaims the 50 EMA and breaks above the trendline, the path of least resistance is down. Be cautious and wait for confirmation at key levels before entering.
Best Wallet ($BEST): Crypto Storage Meets Early Access
Best Wallet is emerging as a leading crypto platform, combining advanced security with seamless access to early-stage tokens. Available on Google Play and the App Store, it supports over 1,000 cryptocurrencies and is the first wallet to integrate Fireblocks’ MPC-CMP security protocol.
One of its standout features is the Upcoming Tokens page, allowing users to purchase presale tokens directly within the app—no wallet connections or external sites required. This secure, no-KYC experience makes Best Wallet ideal for both beginners and seasoned investors.

The $BEST token powers the ecosystem, offering reduced transaction fees, higher staking yields, early project access, and governance rights. Users can also earn through in-app quests and airdrops.
With over $13.45 million raised and the price now at $0.025215, the presale is gaining momentum. Secure your $BEST allocation before the next price jump, and gain early access to a wallet that’s redefining how crypto enthusiasts and investors interact with digital assets.
The post Ethereum Price Prediction: Iran Attacks Send ETH Price Plunging 5% – Key Levels to Watch appeared first on Cryptonews.
https://cryptonews.com/news/ethereum-price-prediction-iran-attacks-send-eth-price-plunging-5-key-levels-to-watch/