


ChatGPT’s AI model processed 42 live indicators, revealing bearish momentum as Dogecoin plunged 5.58% to $0.16241 amid political tensions between Elon Musk and Donald Trump, affecting DOGE agency speculation.
DOGE is trading below all major EMAs with a massive 636.62M volume surge as it tests key support at the $0.155–$0.160 zone.
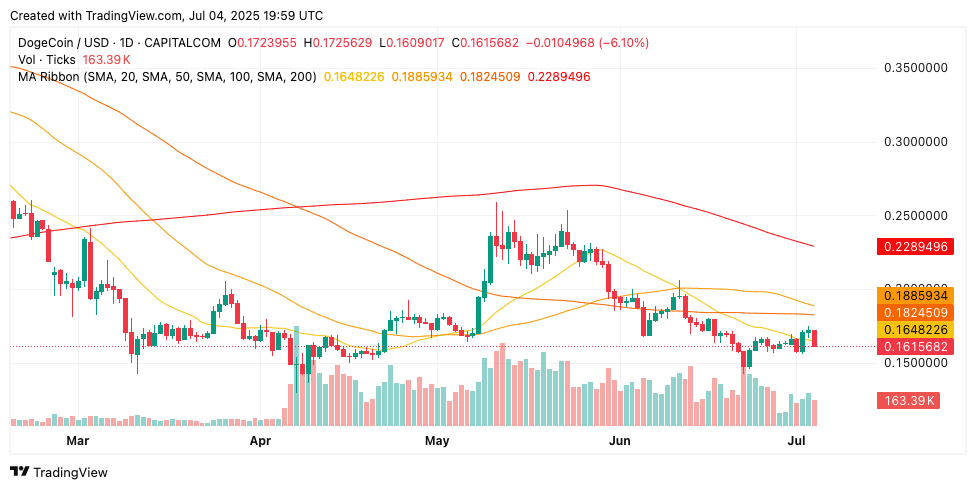
Strong selling pressure emerges as the price falls below the 20-day EMA ($0.16855), 50-day EMA ($0.17932), 100-day EMA ($0.19104), and 200-day EMA ($0.20457), amid heightened political drama, introducing volatility.

The market cap stands at $24.33 billion, with an explosive 42.16% volume surge to $908.02 million, validating institutional repositioning during periods of uncertainty.
The following analysis synthesizes ChatGPT’s 42 real-time technical indicators, political developments, sentiment metrics, and technical patterns to assess DOGE’s 90-day trajectory amid escalating political tensions and chart pattern formations.
Technical Breakdown: Bearish Structure Dominates All Timeframes
Dogecoin’s current price of $0.16241 reflects a major 5.58% daily decline from its opening price of $0.17201, establishing a concerning trading range between $0.17296 (high) and $0.16128 (low).
This $0.01168 intraday spread indicates high volatility during periods of political uncertainty.


RSI at 43.57 approaches oversold territory without reaching extreme levels, indicating balanced momentum despite intense selling pressure. This positioning suggests DOGE remains vulnerable to further declines without immediate reversal signals from technical indicators.
MACD indicators display conflicting readings with the MACD line at 0.00176, trading slightly above zero, which suggests underlying bullish momentum. However, the negative histogram at -0.00733 indicates strong bearish momentum divergence requiring careful monitoring for breakdown cues.
Political Drama Impact: Musk-Trump Tensions Drive Volatility
The political feud between Elon Musk and Donald Trump has introduced volatility to DOGE, with speculation surrounding the DOGE agency creating uncertainty among investors.
This political drama represents a departure from traditional meme-driven rallies, introducing systematic risk to DOGE’s price action.
Elon Musk’s speculation about a new American party has generated increased attention for potential meme coin boom scenarios, although current political tensions have overshadowed these bullish narratives.
The timing of political developments coincides with technical breakdown patterns, amplifying downward pressure.
Ascending Triangle Formation: Bulls Maintain Hope Despite Breakdown
Technical analysts identify a large ascending triangle pattern on weekly charts, representing a classic bullish structure despite current price weakness.
The pattern shows DOGE holding trendline support around $0.17, though the recent breakdown challenges this bullish thesis.
$DOGE Weekly Chart Update$DOGE is forming a large ascending triangle pattern on the weekly — a classic bullish structure!
Holding trendline support around $0.17
Bounced twice off key support zone
Eyes on breakout above $0.25–$0.29 resistance
Targets ahead:… pic.twitter.com/ZeeiVdY9mL — Fabri Crypto (@fabriwtfbro) July 4, 2025


The ascending triangle formation suggests accumulation at higher lows while facing consistent resistance around $0.25–$0.29 levels.
This pattern typically resolves with upward breakouts, though current political tensions complicate traditional technical analysis assumptions.
Multiple bounces off key support zones indicate institutional interest in DOGE accumulation during periods of weakness, although the recent breakdown below triangle support raises questions about the pattern’s validity.
The next few weeks will be key in determining whether bulls can reclaim triangle support or bears continue driving prices lower.
Historical Context: Sharp Correction from January Highs
DOGE’s 2025 performance exhibits extreme volatility following January’s strong close at $0.33, representing the local high for the year.
The subsequent correction to February’s $0.20 and stabilization around $0.17 in March and April established the current trading ranges.
May’s modest recovery to $0.19, followed by June’s decline to $0.16, demonstrates DOGE’s inability to sustain momentum without major catalysts. Current price action represents the continuation of the correction cycle that began after January’s peak performance.
The 51% decline from January highs to current levels reflects DOGE’s high-beta nature and sensitivity to sentiment shifts.
This historical context provides perspective on current weaknesses while highlighting DOGE’s potential for dramatic reversals during periods of positive catalysts.
Support & Resistance: Key Levels Define Next Direction
Immediate support emerges at today’s low of around $0.16128, reinforced by the key support zone at $0.15500-$0.16000.
This confluence represents the most significant technical level for determining DOGE’s near-term direction and potential for deeper correction.
Major support zones extend from $0.14000 to $0.15000, representing historical accumulation levels, followed by strong support from $0.12000 to $0.13000, corresponding to previous cycle lows. These levels provide multiple safety nets during extended correction scenarios.
#Dogecoin is at the third touchpoint of an ascending channel, making it the ideal buy level before a huge surge
$Doge/M1 pic.twitter.com/ZiYlzKPAaG — Trader Tardigrade (@TATrader_Alan) July 4, 2025

Resistance begins immediately at the 20-day EMA, located at $0.16855, representing the first hurdle for any potential recovery attempts.
The key resistance cluster lies between the 50-day EMA ($0.17932) and the 100-day EMA ($0.19104), creating a challenging overhead supply.
Market Metrics: High Volume Confirms Selling Pressure
DOGE maintains a $24.33 billion market capitalization with an exceptional 24-hour trading volume of $908.02 million, representing a massive 42.16% surge. The volume-to-market cap ratio of 3.74% suggests intense selling pressure during periods of political uncertainty.
The high volume surge to 636.62M DOGE confirms institutional repositioning during breakdown attempts, validating technical analysis rather than suggesting accumulation.
This volume pattern supports a bearish interpretation of current price action.

Current pricing represents a 78% discount to the all-time highs achieved in 2021, although comparison to recent highs shows a 51% decline from the January 2025 peaks.
This positioning provides long-term value arguments while acknowledging significant technical damage.
LunarCrush data reveals resilient community engagement with 83% positive sentiment despite recent price weakness.
The social dominance of 2.95% with 2.71 million total engagements demonstrates DOGE’s ability to maintain attention during correction periods.
Recent social themes have focused on ascending triangle formations, accumulation opportunities, and long-term bullish scenarios targeting the $1 level.
Community discussions emphasize technical patterns while acknowledging the short-term political headwinds that affect price action.
The disconnect between social sentiment (83% positive) and technical indicators (bearish) represents typical DOGE community behavior during correction periods. This resilient sentiment provides fundamental support for eventual recovery scenarios.
90-Day DOGE Price Forecast
Political Resolution Rally (Bull Case – 30% Probability)
Resolution of Musk-Trump political tensions, combined with a breakout from an ascending triangle, could drive the recovery toward $0.25–$0.29, representing a 54–79% upside.
This scenario requires political clarity and successful defense of $0.155–$0.160 support zone with volume confirmation.
Technical targets include $0.20, $0.25, and $0.29 based on triangle pattern measurements and historical resistance levels. The meme coin narrative could resurface strongly if political uncertainties resolve favorably for DOGE-related speculation.
Extended Correction (Base Case – 50% Probability)
Continued political uncertainty and technical breakdown could drive DOGE toward $0.12–$0.14, representing a 14–26% downside.
This scenario assumes ongoing political tensions and failure to hold key support levels during summer trading periods.
Support at $0.155–$0.160 would likely fail during an extended correction, with volume normalizing around 400–500 million DOGE daily. This sideways-to-downward action provides better accumulation opportunities for long-term holders seeking lower entry points.
Deep Correction (Bear Case – 20% Probability)
Severe political escalation or broader market weakness could trigger a correction toward $0.10–$0.12, representing a 26–38% downside.
This scenario would require strong negative catalysts beyond current political tensions.

The strong community sentiment and meme coin resilience limit extreme downside scenarios, with major support at $0.12–$0.13 providing key long-term trend support for future recovery cycles.
DOGE Forecast: Political Drama Meets Technical Breakdown
DOGE’s current positioning reflects the convergence of political uncertainty, technical breakdown, and community resilience.
The 42-signal analysis reveals that the cryptocurrency is positioned at a key juncture between pattern continuation and a major correction.
Current consolidation around $0.16 with critical support at $0.155–$0.160 creates a decision point for DOGE’s trajectory. The combination of political drama, technical weakness, and community optimism positions DOGE for volatile price action as catalysts develop throughout Q3 2025.
The post ChatGPT’s 42-Signal DOGE Analysis Flags Key $0.155 Support Test Amid Musk Drama appeared first on Cryptonews.
https://cryptonews.com/news/chatgpt-42-signal-doge-analysis-0-155-support-test/


